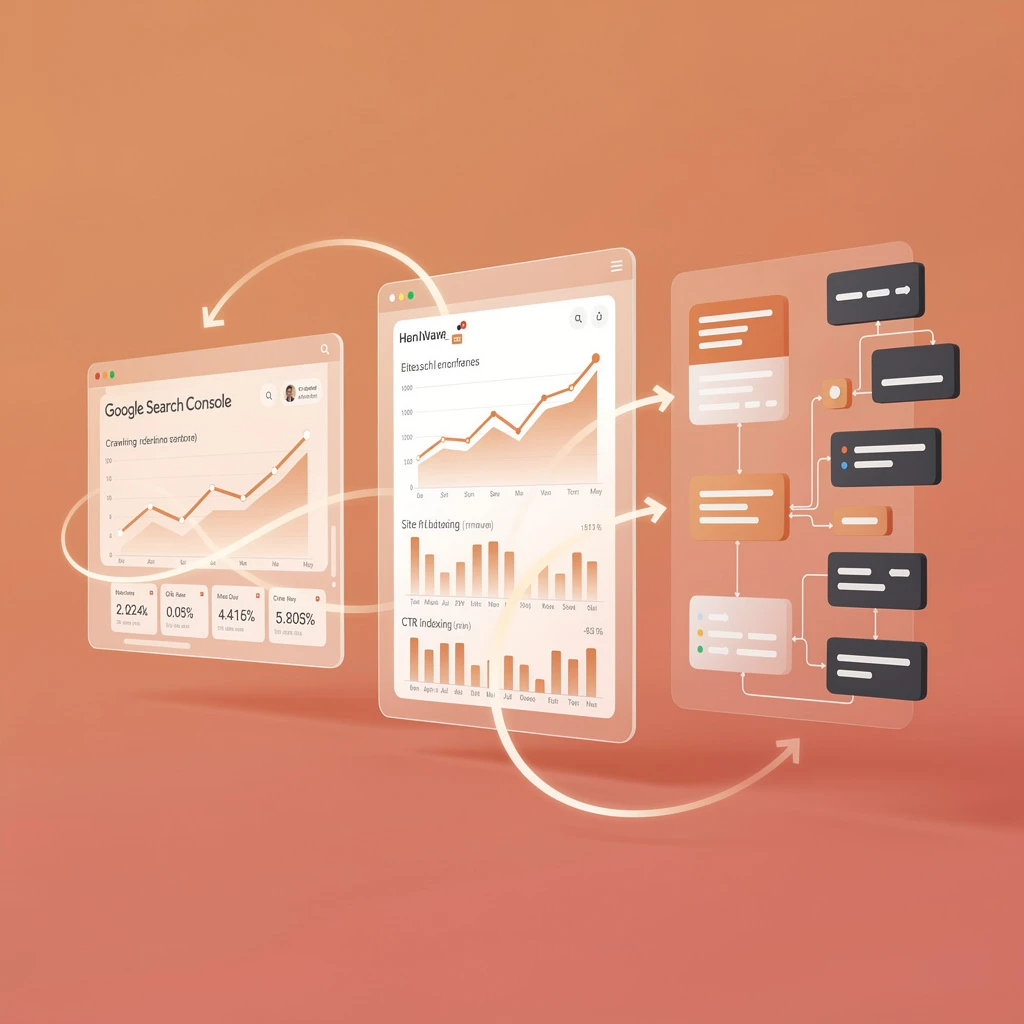
Google Search Console is the most underused free SEO tool available to marketers. Most teams verify their site, glance at the dashboard once, and never return — leaving a goldmine of actionable data untouched.
That’s a costly mistake. GSC is the only tool that shows you exactly how Google sees your website: which queries trigger your pages, which URLs are blocked from the index, which pages have Core Web Vitals problems, and which links Google has discovered pointing to your site.
This tutorial covers every significant GSC feature, from initial setup to advanced diagnosis, so you can make decisions based on data instead of guesswork.
Setting Up Google Search Console
Before any data appears, you need to verify site ownership. This is a one-time process that takes under ten minutes.
Property Types: Domain vs. URL Prefix
GSC offers two property types, and the choice affects what data you see.
Domain property (recommended): Covers all subdomains (www, blog, shop) and both HTTP and HTTPS. Requires DNS TXT record verification — you add a record through your domain registrar (GoDaddy, Cloudflare, Namecheap).
URL prefix property: Covers one specific URL pattern (e.g., https://www.example.com). Simpler to verify but misses data from subdomains and protocol variants.
For most businesses, create a domain property. The verification takes 24-48 hours for DNS propagation but gives you complete data coverage.
Verification Methods
| Method | Best For | Time Required |
|---|---|---|
| DNS TXT record | Any site with domain access | 24-48 hours (DNS propagation) |
| HTML tag | Sites where you control <head> | Instant |
| HTML file upload | Developers with server access | Instant |
| Google Analytics | Sites with GA4 already installed | Instant |
| Google Tag Manager | Sites using GTM | Instant |
If you already have GA4 set up, use that verification method — it takes one click. Our guide on how to set up Google Analytics 4 walks through GA4 configuration if you’re starting fresh.
Linking GSC to Google Analytics 4
After verification, link your GSC property to GA4. This unlocks the “Organic Google Search” traffic channel in GA4 with query-level data — a significant insight upgrade.
To link:
- In GA4, go to Admin → Property → Search Console Links
- Click Link and select your verified GSC property
- Choose the data stream (your website)
- Save
Once linked, organic search queries appear in GA4’s Acquisition → Traffic Acquisition report. Use this to tie search queries to on-site behavior and conversions — a critical step in understanding marketing attribution.
Submitting Your Sitemap
Submit your XML sitemap immediately after verification. Go to Sitemaps → Add a new sitemap and enter the sitemap URL (usually yourdomain.com/sitemap.xml or yourdomain.com/sitemap_index.xml).
A submitted sitemap accelerates discovery of new pages and gives Google a complete picture of your site structure. Check back in 48 hours to confirm the status shows “Success” rather than errors.
Understanding Your GSC Performance Dashboard
The Performance report is where most SEO analysis begins. It shows every query, page, country, device, and search appearance that generated an impression or click from Google Search.
Four Core Metrics
Impressions: How many times your page appeared in search results (whether clicked or not). High impressions with low clicks indicate title tag or meta description problems.
Clicks: How many times users clicked your result. This is the metric closest to actual organic traffic.
Average Position: Your average ranking position for a query. Position 1-3 is the goal for high-value keywords; positions 4-10 represent quick-win improvement opportunities.
CTR (Click-Through Rate): Clicks ÷ Impressions. The Search Engine Land benchmark data shows position 1 generates roughly 28% CTR for informational queries, dropping to 15% at position 3. To understand how these four GSC metrics fit into your complete SEO KPI framework, that guide shows benchmarks for all 12 core metrics alongside where to find each one.
Reading the Performance Report Effectively
The default 3-month view is too short for trend analysis. Set the date range to 16 months (the maximum available) to see full seasonal patterns and year-over-year comparisons.
Query analysis: Sort by Impressions descending. Identify:
- Queries with high impressions but below 3% CTR → rewrite those title tags and meta descriptions
- Queries where you rank 8-15 → these are the fastest wins; a focused content update can push them to page 1
Page analysis: Switch to the Pages tab. Sort by Clicks. Your top-traffic pages are your highest-priority assets to protect and optimize.
Comparison view: Use the date comparison feature to benchmark month-over-month or year-over-year. A sudden drop in clicks for a specific page without a position change usually indicates a CTR problem (title change, SERP feature stealing clicks). A drop in both clicks and position suggests a ranking regression. Pairing GSC with an AI search monitoring platform adds real-time anomaly alerts on top of GSC’s position data, giving you faster diagnosis when regressions appear.
Search Appearance Filters
GSC breaks down performance by search type: Web, Image, Video, and News. If you publish videos or images, check these tabs separately — they often reveal traffic opportunities that the default Web view hides.
Rich results appear as a separate filter when your pages generate structured data features like FAQs, How-tos, or Review stars. High impression rich result queries that don’t appear on your web report represent untapped visibility.
Want to turn GSC data into real revenue? GrowthGear has helped 50+ startups build SEO strategies that deliver 156% average growth. Book a Free Strategy Session to build a search strategy grounded in your own GSC data.
Using GSC to Fix SEO Issues
The Performance report tells you what’s happening. The Index, Experience, and Enhancement reports tell you why — and what to fix.
Index Coverage: Understanding the URL Inspection Tool
The Coverage report (now called Pages in newer GSC interfaces) categorizes every URL Google has encountered across four states:
| Status | Meaning | Action Required |
|---|---|---|
| Indexed | Page is in Google’s index | Monitor for traffic |
| Not indexed | Google found but excluded the page | Investigate each reason |
| Excluded | Intentionally excluded (noindex, canonicalized away) | Verify this is intentional |
| Error | Googlebot couldn’t crawl the page | Fix immediately |
The most common “Not indexed” reasons and their fixes:
- “Discovered - currently not indexed”: Google knows the URL exists but hasn’t crawled it yet. Check crawl budget by running a technical SEO audit. Submit the URL via URL Inspection.
- “Crawled - currently not indexed”: Google crawled the page but chose not to index it. Usually indicates thin content, duplicate content, or a page that doesn’t provide unique value.
- “Duplicate, Google chose different canonical than user”: Your canonical tag points to URL-A, but Google indexed URL-B. This signals a content duplication issue requiring canonical tag review.
- “Blocked by robots.txt”: Your robots.txt is preventing Googlebot access. Check
yourdomain.com/robots.txtimmediately.
URL Inspection Tool: The Most Powerful GSC Feature
Select any URL in your Performance report, then click the URL Inspection icon (the magnifying glass). This shows:
- Whether the URL is indexed
- The last crawl date and Googlebot version used
- The rendered HTML (what Google actually sees)
- Canonical URL (what Google treats as the primary version)
- Mobile usability status
- Any structured data detected
The “Test Live URL” button fetches the page in real-time and shows you exactly what Googlebot sees today — including whether your JavaScript renders correctly. This is invaluable for debugging indexing issues on SPAs and JavaScript-heavy sites.
After fixing an issue, use “Request Indexing” to ask Google to recrawl the URL. This doesn’t guarantee immediate indexing, but it prioritizes the URL in Googlebot’s queue.
Core Web Vitals Report
GSC’s Core Web Vitals report separates URLs into Good, Needs Improvement, and Poor buckets based on field data from real Chrome users (CrUX data). This is distinct from lab data you get in PageSpeed Insights — field data reflects actual user experience.
Focus on pages in the Poor bucket first. The metrics:
- LCP (Largest Contentful Paint): Target under 2.5 seconds. Usually caused by unoptimized hero images or slow server response.
- INP (Interaction to Next Paint): Target under 200ms. High INP indicates excessive JavaScript blocking user interactions.
- CLS (Cumulative Layout Shift): Target under 0.1. Caused by images without defined dimensions or ads that shift layout on load.
Click into any poor-status URL group to see which specific pages are affected, then diagnose with PageSpeed Insights at the page level.
Manual Actions
Check Security & Manual Actions → Manual Actions after every significant site change. A manual action is a penalty applied by a Google reviewer — it directly suppresses rankings for the affected URLs.
Common manual actions include:
- Spammy structured data: Misleading schema markup
- Unnatural links: Manipulative link building patterns
- Thin content with little or no added value
- User-generated spam: Comment or forum spam on your site
If you have a manual action, the report explains the reason. Fix the underlying issue and submit a Reconsideration Request through GSC. Resolution typically takes 2-4 weeks after submission.
Advanced GSC Features for Growth
Beyond diagnosis, GSC contains features most marketers never explore — and that’s where the biggest competitive advantages live.
Link Analysis: Internal and External
The Links report shows:
- Top linked pages externally: Which of your pages attract the most backlinks
- Top linking sites: Your referring domain profile
- Top linked pages internally: How your site’s link equity flows
Use the external links data to identify your most link-worthy content. Pages with many backlinks already have authority — adding more depth or freshness to those pages compounds the benefit.
Internal link data reveals whether your most important pages are well-supported. If a commercial landing page appears rarely in the internal links list, add contextual links from high-traffic blog posts. This directly flows PageRank to pages that need it. For a full approach to increasing organic traffic, internal linking is one of the highest-ROI tactics available.
Search Analytics API for Power Users
GSC exposes its data via the Search Analytics API, which lets you:
- Pull up to 16 months of query data programmatically (versus the 16-month limit in the UI)
- Automate weekly rank tracking reports
- Feed GSC data into dashboards and BI tools like Looker Studio
For teams managing multiple sites, the API eliminates manual reporting. Pair it with AI data analysis tools to identify patterns across large keyword sets automatically.
International Targeting and hreflang Validation
If your site serves multiple countries or languages, the International Targeting report validates your hreflang implementation. Hreflang errors are among the most impactful technical issues for multinational sites and among the least commonly diagnosed.
Check this report for:
- hreflang tags pointing to non-indexed URLs
- Missing return tags (each hreflang pair requires a reciprocal tag)
- Conflicting canonical and hreflang signals
Enhancements: Structured Data Validation
The Enhancements section lists every structured data type Google has detected on your site: FAQs, How-tos, Products, Reviews, Breadcrumbs, and more.
Each type shows valid, warning, and error counts. Errors mean the structured data won’t generate rich results. Common causes:
- Missing required fields (e.g.,
pricerequired for Product schema) - Using deprecated properties
- Markup not matching visible page content
Rich results directly increase CTR. Moz’s structured data research consistently shows 20-30% CTR improvements when FAQ or How-to rich results appear. Fix every structured data error — it’s free visibility.
Setting Up Email Alerts
GSC sends alerts for critical issues, but only if you have notifications configured. Go to Settings → Notifications and enable alerts for:
- Coverage errors exceeding a threshold
- Manual actions (these should always be on)
- Security issues (malware, hacking)
Critical issue alerts should go to at least two team members. A manual action or security problem that sits unnoticed for weeks can cause catastrophic ranking losses.
Connecting GSC to Third-Party Tools
GSC data becomes more powerful when combined with external platforms:
Ahrefs and Semrush: Both integrate with GSC to layer your keyword ranking data with competitor intelligence. The Ahrefs GSC integration guide shows how to map your current rankings against keyword difficulty to prioritize content investment.
Looker Studio: Build automated dashboards that pull GSC data alongside GA4 conversion data. This gives your team a single view of the full funnel — from search query to revenue.
CRM and lead gen tools: For B2B marketers, connecting organic traffic data to lead generation performance shows which SEO topics drive actual pipeline, not just traffic.
Grow Your Search Performance, Grow Your Business
Google Search Console is only as valuable as the actions you take from it. The teams that win at SEO treat GSC as a weekly ritual — not a one-time setup task.
Whether you’re diagnosing a rankings drop, optimizing CTR on high-impression queries, or building a systematic content refresh process, GrowthGear can help you extract maximum ROI from your search channel. Our clients average 156% growth by turning data into decisions.
Book a Free Strategy Session →
GSC Workflow: A Repeatable Weekly Checklist
To get consistent value from Google Search Console, work through this checklist every week:
| Task | Where in GSC | What to Look For |
|---|---|---|
| Check coverage errors | Pages → Not Indexed | New errors since last week |
| Review Core Web Vitals | Experience → Core Web Vitals | New Poor URLs |
| Monitor top queries | Performance → Queries | CTR drops, impression changes |
| Inspect new pages | URL Inspection | Confirm new posts are indexed |
| Check manual actions | Security & Manual Actions | Any new penalties |
| Review internal links | Links → Internal | Under-linked priority pages |
Run this checklist in under 20 minutes. Schedule it for the same day each week so it becomes habit rather than reactive firefighting.
Pairing GSC with a conversion rate optimization strategy closes the loop: GSC brings users to your pages; CRO ensures those users convert into customers.
Frequently Asked Questions
Yes. Google Search Console is completely free. Any website owner with a verified property can access all reports, including Performance, Index Coverage, Core Web Vitals, and the URL Inspection tool.
GSC typically shows data within 2-3 days of verification, but performance data can be delayed up to 3 days. Index coverage and crawl data appear within 48 hours of Googlebot visiting your site.
GA4 tracks user behavior on your site (sessions, conversions, events). GSC tracks how Google crawls, indexes, and ranks your site. Both are essential — GSC shows what happens before the click, GA4 shows what happens after.
Verify via HTML tag (add to <head>), HTML file upload, Google Analytics, Google Tag Manager, or DNS TXT record. The DNS method is most reliable for sites where you can't easily edit code.
Check GSC weekly for performance trends and any new Coverage or Core Web Vitals alerts. Set up email alerts in GSC settings so critical issues (manual actions, crawl anomalies) notify you immediately.
CTR is the percentage of impressions that result in a click. CTR = Clicks ÷ Impressions. A low CTR on high-impression queries signals weak title tags or meta descriptions that need rewriting.
Yes. Filter the Performance report by a specific keyword. If multiple URLs appear for that query, you have cannibalization. The page with higher CTR and more clicks should be the canonical target.